Beverage Alcohol – Are Gen Z or Baby Boomers the Problem?
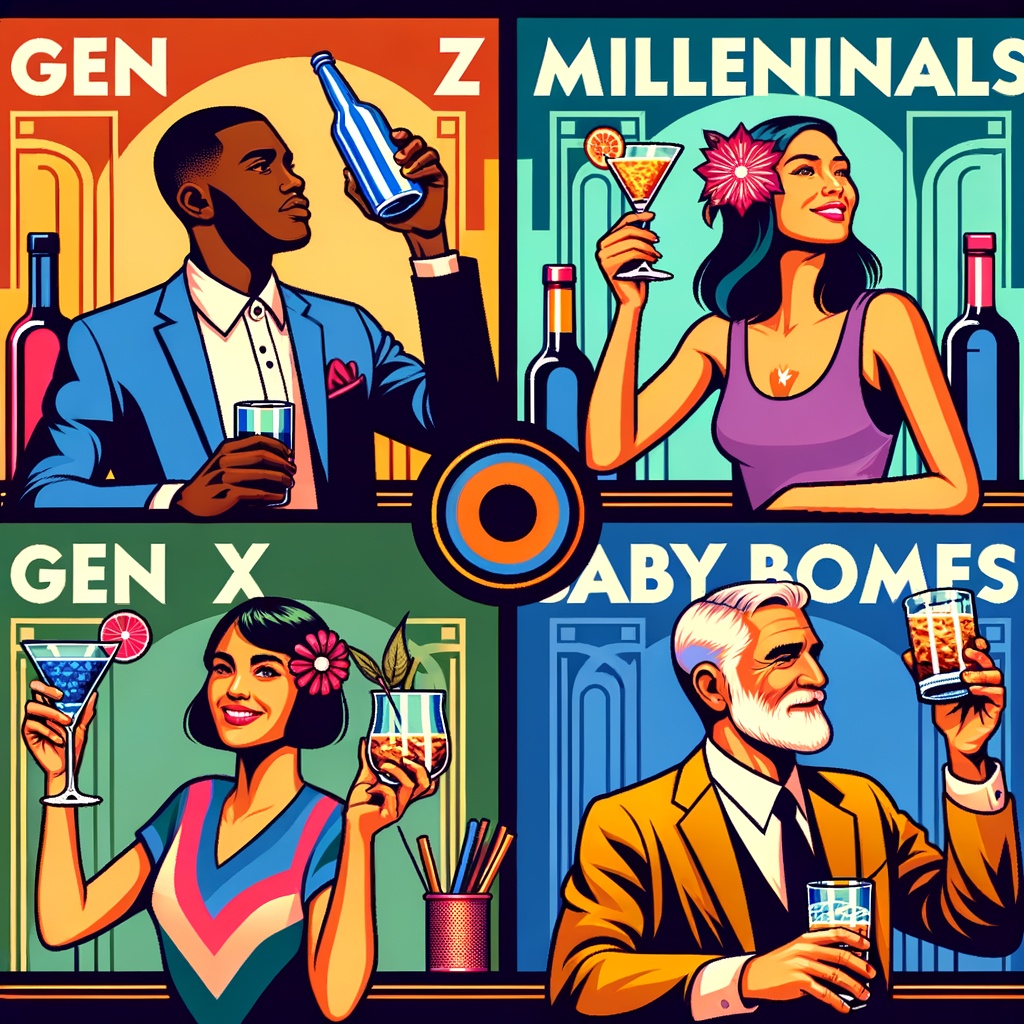
Recent industry coverage has framed declining beverage alcohol consumption as a Gen Z problem or a Baby Boomer problem. NSDUH data suggests the issue is broader: younger consumers drink less often and consume fewer servings when they do drink, while older consumers naturally reduce consumption as they age. The industry challenge is not choosing which generation to blame; it is rebuilding beverage alcohol occasions across multiple age cohorts.
- Percentage of the population that drinks beverage alcohol.
- The number of occasions that people drink beverage alcohol.
- The number of servings that they drink per occasion.
The best source we know for tracking these three factors over time is the U.S. National Survey on Drug Use and Health (NSDUH)*. Below are four charts derived from annual surveys from 2000 to 2024, covering 25 years of data. Over this period, 1 million respondents participated, 40,000 per year. By comparison, during this period, the total number of respondents to the Gallup surveys was likely less than 40,000, or 4% of NSDUH respondents.
The charts look at beverage alcohol use for four age groups. The two metrics presented are:
- The percent of each age group that reported drinking beverage alcohol each year.
- The second metric is the reported average servings per week, calculated from the number of occasions respondents said they consumed beverage alcohol during the year and the average number of servings they reported per occasion. Consider this second metric to be “intensity”. One important caveat is that respondents materially underreport consumption: across the 25-year period, consuming adults reported an average of 5 servings per week, while market-level volume implied roughly 15 servings per week. This gap matters because the directional trend is useful, but the absolute level is understated.
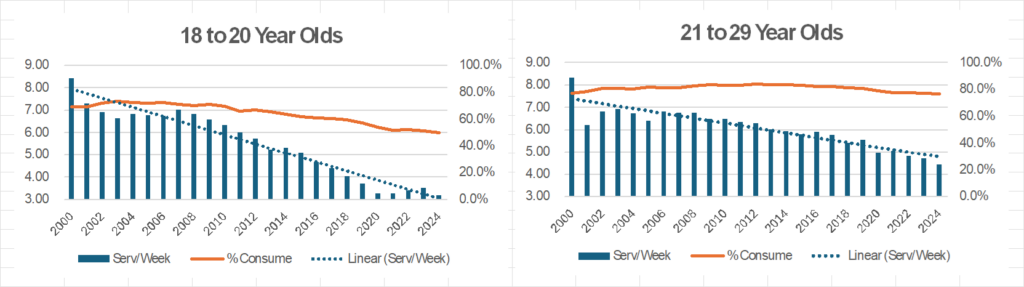
The key distinction is between participation and intensity. Participation shows whether people drink at all, while reported servings per week show how often and how much they drink. Looking at both measures prevents the analysis from overstating one generation’s importance while missing the broader decline in drinking occasions and reported volume.
- 18 to 20-year-olds: Generally underage college students
- The percentage that reports consuming beverage alcohol has dropped from 70% to 50%.
- Reported servings per week have dropped from 7 to 3.
- The declines began in 2009, driven first by younger millennials rather than Gen Z, and they have continued with Gen Z. A reduction in underage drinking is a positive development. It may also imply that drinking is no longer the same rite of passage it was for prior generations.
- 21 to 29-year-olds: In 2024, this was primarily Gen Z.
- Declines started in 2012, likely the same younger millennials from the 2009 underage college drinkers. The declines have continued since then.
- For 21- to 29-year-olds, the share reporting beverage alcohol consumption has remained near 75%, which suggests many people who did not drink in college begin drinking once they reach legal drinking age. The pressure point is not participation; it is intensity. Reported servings per week have declined from 6.5 to 4.5, a roughly 30% reduction.
- If this cohort continues to drink less than prior generations, the industry will see continued volume declines in the U.S.
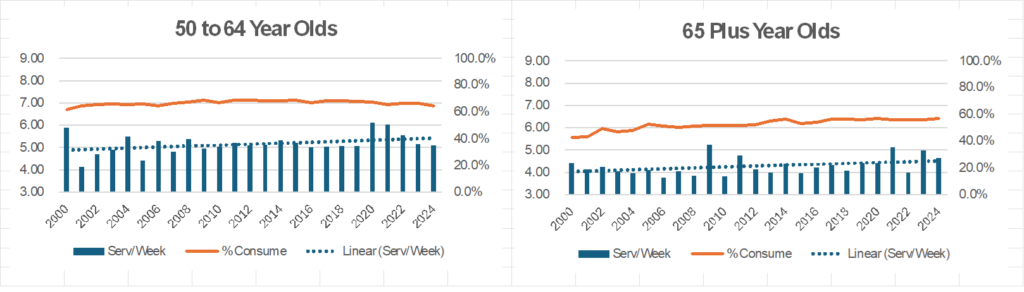
- 50 to 64-year-olds:
- The percentage that reported consuming beverage alcohol has been consistent at 65%. 30 to 49-year-olds are not shown, but their consumption has stayed consistent at about 75%.
- Servings per week have been consistent at 5 servings per week. Servings per week for 30 to 49-year-olds have been just above 5 servings per week.
- The data show that, over time, the percentage that drinks slowly declines and that their reported consumption slowly declines.
- 65 Plus year olds: In 2024, the majority of Baby Boomers fell in this age group.
- As people age, fewer people drink alcoholic beverages, and their reported consumption slowly declines.
- As more Baby Boomers have moved into the 65-plus cohort, the share of people who drink and their reported average servings per week have shown some increases. However, these have still declined compared with the 50- to 64-year-old cohort.
Overall, Baby Boomers are drinking less, which is a natural trend as people age. Gen Z is also drinking less, which is driven by fewer occasions and fewer servings per occasion, lower intensity. To reverse these trends, the industry needs to convince consumers to enjoy beverage alcohol on more occasions and to increase their servings per occasion. Over the last thirty years, the industry has mainly focused on taking share between categories, while servings entering the market have grown in line with the population of legal drinkers. With consumption declining, the industry must address several headwinds that require a completely new playbook. A few of these are:
- The last time the industry saw declines in consumption was in the 1980s. At that time there was not the competition from other beverages such as Energy drinks, functional beverages, THC-based beverages etc. The industry needs to recapture occasions from other beverages, not just take share from other beverage alcohol categories.
- Consumers have more demands or opportunities for their disposable income. Whether this is non-discretionary, such as student loan debt or rising car costs, or discretionary spending such as online gambling. The industry needs to fight for a higher share of discretionary spending.
- The industry has been bombarded by negative links between alcohol and health. The industry circulates positive reports in industry newsletters, but they do not reach broad distribution in the general press or newsfeeds.
- Some industry members believe negative press has declined and that the category may be moving past the peak of that cycle. However, health concerns remain highly visible in consumer-facing information channels, including search results, social media, and AI-generated summaries.
- The industry also needs to recognize that parents and their children are increasingly exposed to simplified health messages about alcohol at school, online, and through public-health campaigns.
- The industry is concerned about product liability and becoming the next Tobacco.
- As noted above, consumers underreport their consumption of beverage alcohol. A preliminary review of some alcohol and cancer research indicates reported consumption similar to the NSDUH data. This suggests the point at which risk increases is probably higher than in studies. Is industry willing to dig into the actual data?
- Alcohol is classified as a carcinogen, like tobacco. So are hot dogs and cured meats. When looking at tobacco, it is broadly accepted that smoking increases the risk of lung cancer by 2X to 5X. This is 200% to 500%. Studies suggest, based on correlation, not direct causation, that alcohol use increases the risk of breast cancer in women by 10%. The baseline risk is 10%. Alcohol use supposedly increases it to 11%, which is 10% of 10%.
- Tied to health, it is becoming more acceptable that a woman can have one drink a day, a man two drinks a day, and no more than 4 or 5 days a week. This means that a couple should not enjoy a bottle of wine over dinner. Accepting these consumption levels will ensure a continued decline in the overall industry.
- Also tied to health are GLP-1s. Use is increasing and will likely lead to declines in food and beverage consumption.
The Gen Z versus Baby Boomers question is only part of the puzzle. The larger challenge is how the market can make beverage alcohol relevant on more occasions, for more consumers, at reasonable consumption levels, while competing with other beverages, health concerns, and shifting discretionary spending.
*NSDUH is managed by the Substance Abuse and Mental Health Services Administration (SAMHSA), a sister agency to the National Institutes of Health (NIH) within the U.S. Department of Health and Human Services. It was initiated in 1978 and has been conducted annually since 1990. The survey includes respondents beginning at age 12. The age groups above have been consolidated. Detailed 2025 data should be available in the fourth quarter of 2026. Contact [email protected] if you are interested in acquiring a broader dataset.