bw166 2026 mid-year Update

US Beverage Alcohol – 2026 Mid-Year Update
The US beverage alcohol market remains under pressure in 2026, with beer, wine, and spirits all showing continued volume softness, even as consumer spending remains relatively resilient.
- Beer volume over the last 12 months totaled 174 million barrels, down 5.6% year over year. The six-month trend is down 5.1%. Imports are slightly outperforming domestic beer.
- Wine volume over the last 12 months totaled 345 million 9L cases, excluding cider, down 5.7% year over year. The six-month trend is down 6.7%. Domestics are slightly outperforming imports.
- Spirits volume over the last 12 months totaled 288 million 9L cases, down 7.4% year over year. The six-month trend is down 8.1%. Domestics continue to outperform imports.
- Spirits-based RTD shipments were flat over the last 12 months and now account for 28% of all spirits shipments into the US during that period.
Bureau of Economic Analysis data helps track consumer spending. Over the past 12 months, off-premise spending totaled $254 billion, up 1.6%, while on-premise spending totaled $181 billion, up 5.2%. The divergence between volume trends and consumer spending reflects several factors, including shipment timing, markup expansion, especially in on-premise channels, and continued premiumization across the industry.
To put shipment trends into a consumption context, bw166 also converts beverage alcohol volume into servings and servings per legal drinking age adult. Servings are calculated by bw166 using the following conversion
- Beer: 1 serving = 12 ounces
- Wine: 1 serving = 5 ounces for traditional wine and 12 ounces for flavored wine beverages
- Spirits: 1 serving = 1 ½ ounces of traditional spirits, 3 ounces of cordials and 6 ounces of packaged cocktails/RTDs.
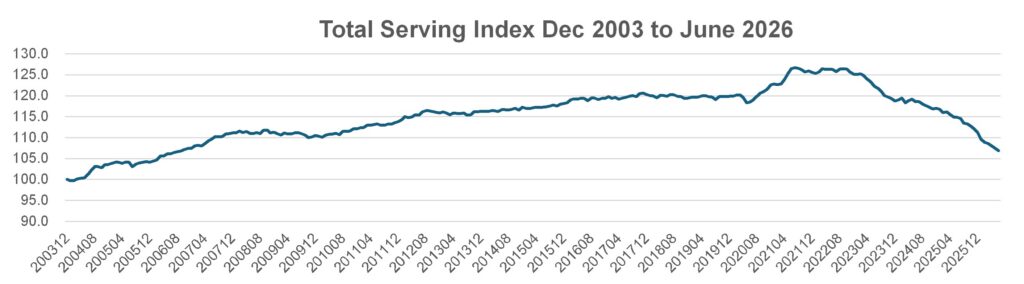
A serving index is calculated where 2003 = 100. The Total serving index over the past 12 months is 107, down 6.9%, meaning that total servings entering the market are up only 7% versus 2003. The serving index peaked at 126 in 2021.
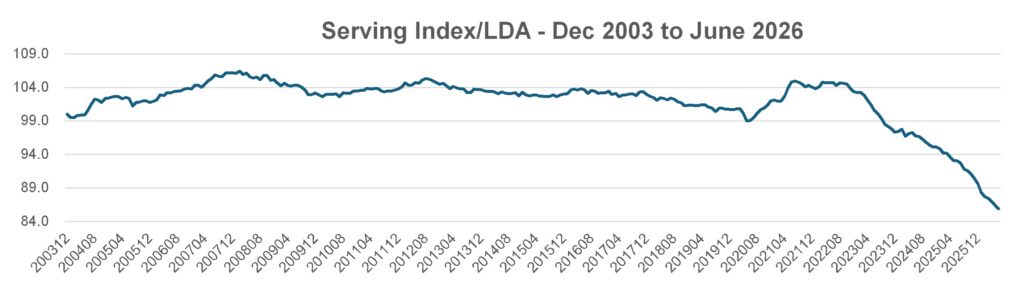
Looking at servings per legal drinking age (LDA) adult, the index for the last 12 months is 85.9, -7.6% versus a year ago. The index had approximated 100 (+/-5%) from 2003 until 2021. Consumption per capita had been very stable but has declined significantly post-pandemic.
The shipment data repository that bw166 uses contains annual data back to the repeal of prohibition and monthly data since at least 2000. Shipment data typically tracks very close to depletion data and total consumer takeaway. Since the start of the pandemic, there has been significant disruption to short-term trends, but they balance out over time. For twelve months through June 2026, there is a slight distortion due to increased import shipments in the first quarter of 2025, ahead of threatened tariffs versus soft imports in the first quarter of 2026. These do not materially impact the overall trends, but the negative trends may be slightly overstated.
Methodology – bw166 combines TTB and customs data to track beverage alcohol shipments into the US market. Proprietary algorithms are used to estimate data not yet released when the TTB overview is published each month. Historical accuracy has generally remained within ±1.0% for six-month data and ±0.5% for 12-month data.
The June 2026 data incorporate projections for:
June customs data
May and June TTB beer and wine data
April through June TTB spirits data
Monthly state data from approximately 20 reporting states are also used to cross-check the results.
For more information, please see www.bw166.com